
|
|

|
||||||||||||||||
|
MADIBA TutorialWhy MADIBA?What is MADIBA? Program input Description of the database Description of the output 5 analyses modules
Some results Why MADIBA?An understanding of biological mechanisms of organisms become possible with the availability of complete genome data in combination with high-throughput methodologies such as microarray, suppression subtractive hybridization (SSH) or proteomics platforms. In parallel, numerous databases provide annotation at different biological levels; such as molecular functions, biological processes, cellular components of the gene with the Gene Ontology nomenclature; metabolic pathways like in KEGG, BioCyc, as well as the annotation of promotors with the Transcription Factor Binding Sites (TFBS) in TRANSFAC.Gene expression data are firstly normalised, filtered and finally clustered to groups of genes with similar expression profiles. The biological hypothesis behind this last statistical step is that the genes are similarly expressed because they have a biological common characteristic for example, participation in the same biological process, regulation by a common transcription factor and/or have the same chromosomal localisation. To facilitate the post-analysis of gene expression experiments, we propose MADIBA an interface with a relational database of various data and a series of analysis tools to assist in the identification of possible reasons for the common expression of a cluster of genes. While initially built for Plasmodium falciparum (malaria parasite) data, MADIBA has since been expanded to include data for Oryza sativa ssp japonica (Japanese Rice) and Arabidopsis thaliana, both being important model plant species for monocotyledons and dicotyleons respectively. What is MADIBA?MADIBA (MicroArray Data Interface for Biological Annotation), is a tool who facilitates the assignment of biological meaning to gene expression patterns by automating the post processing stage. A relational database includes data from the gene to the pathway information and a web interface with tools allows:
Program inputA cluster of genes can be submitted via file uploading from the web interface. The input can be a list of gene names:Example :
PFD0450c
PFB0640c
PFB0320c
PFL1940w
or a list of nucleotide sequences in fasta format:
>PFA0005w
ATGGTGACGCAAAGTAGTGGTGGGGGTGCTGCTGGTAGTAGTGGTGAGGA
AGATGCCAAACATGTATTGGATGAATTTGGGCAACAAGTGTACAATGAAA
Description of the databaseA PostgreSQL database is used to store downloaded and precalculated data.The downloaded data consists in the data from the PlasmoDB database for P. falciparum as well as data from TIGR (The Institute for Genome Research) for Rice data, and TAIR (The Arabidopsis Information Resource) contains:
Description of the outputIf sequences are submitted, a BLAST search is performed to find the best hit in the genome of the organism in question. BLASTN is performed for Arabidopsis and Plasmodium and BLASTX is performed for rice, to allow the possibility of entering orthologous gene clusters from other cereals. The top 5 results are returned for each gene sequence submitted, with the top hit selected by default.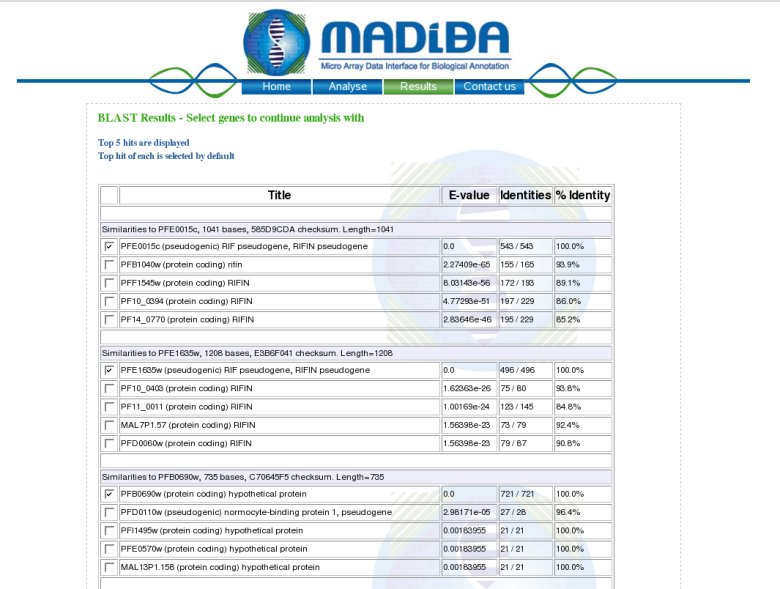 Once submitted, a table is returned with the functional annotation and the links to 5 analyses (Gene Ontology, Metabolic Pathways, Chromosomal Localisation, Transcription Regulation and Organism Specific). 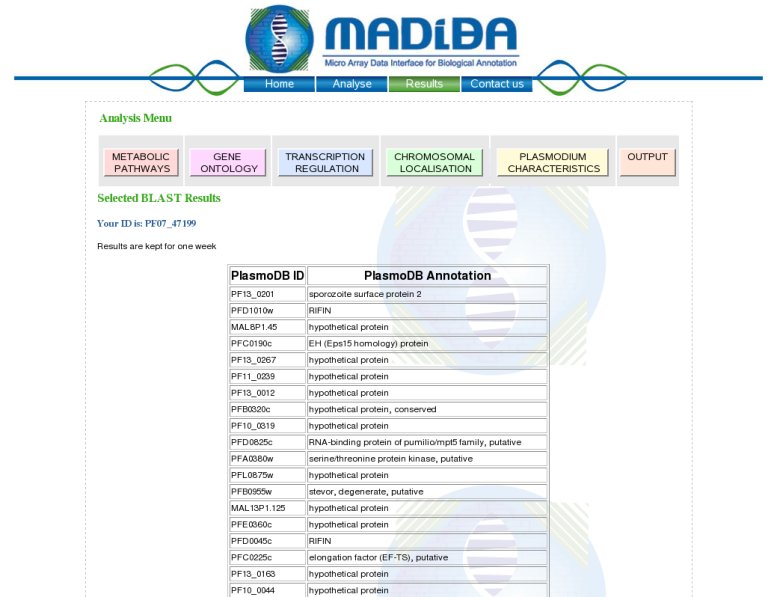 5 analyses modulesGene Ontology module:This analysis module automatically extracts the Gene Ontology (http://www.geneontology.org) annotation according to the molecular functions, the biological processes and the cellular components.Moreover a hypergeometric P value for each annotation is also proposed to evaluate the significance of each of the annotations.Example: Molecular Function 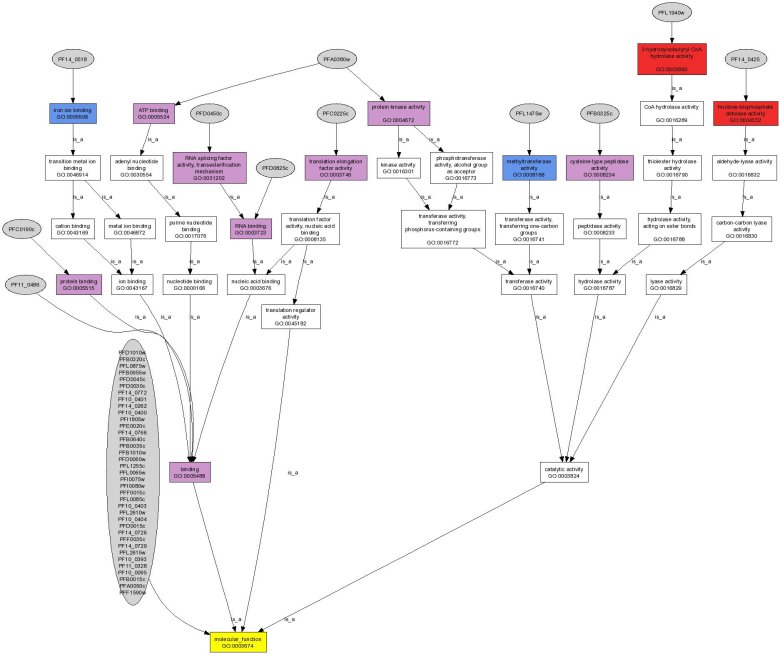
Metabolic Pathways module:In this module we compare the enzymatic annotation from 3 different sources of annotations: partially curated annotation of PlasmoDB, TIGR or TAIR; a semi-automatic annotation of KEGG and an automatic annotation of PRIAM. The result of this comparison is visualized in the KEGG metabolic pathways, with the number of enzymes found in each pathway. A color code is used to allow to the user to see the background annotation of the genome with the agreement between the 3 methods and also the genes found in the analysed cluster.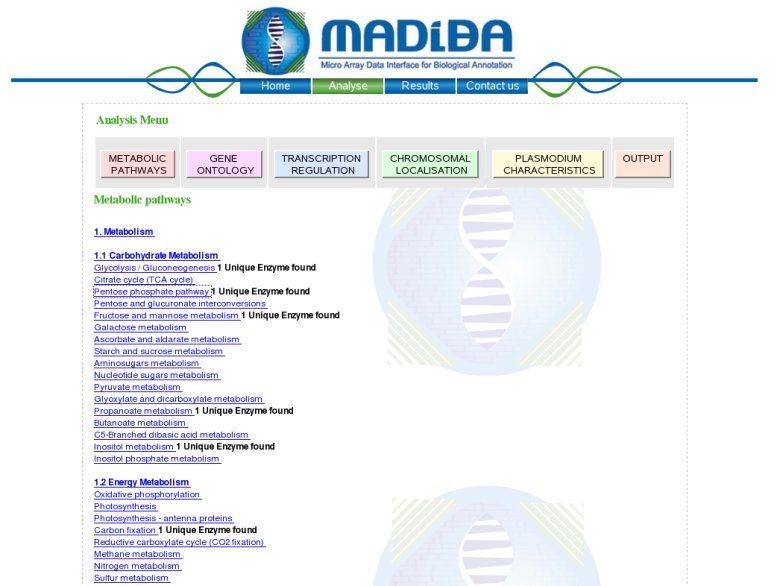 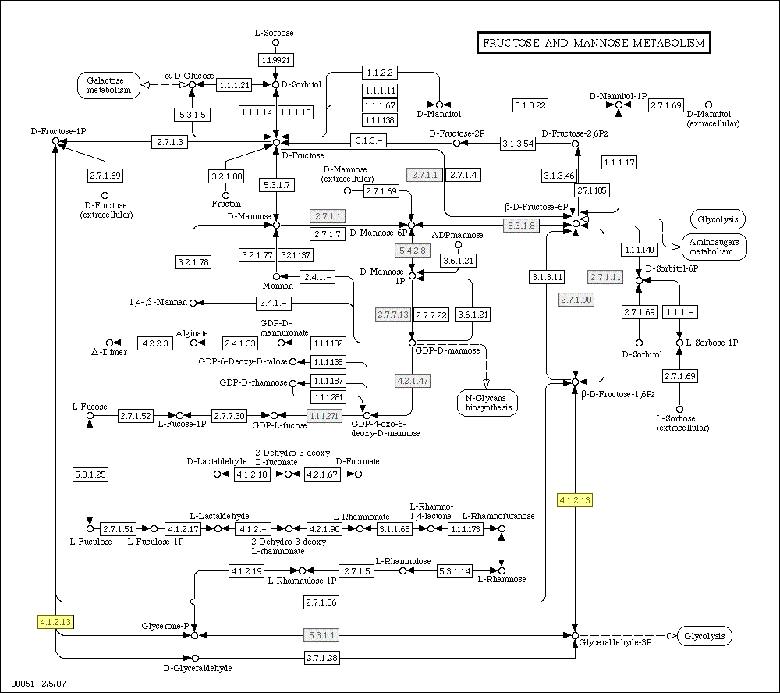 Clicking on any other enzymes or compounds will bring up more data on that element. This data is retrieved from the KEGG site. 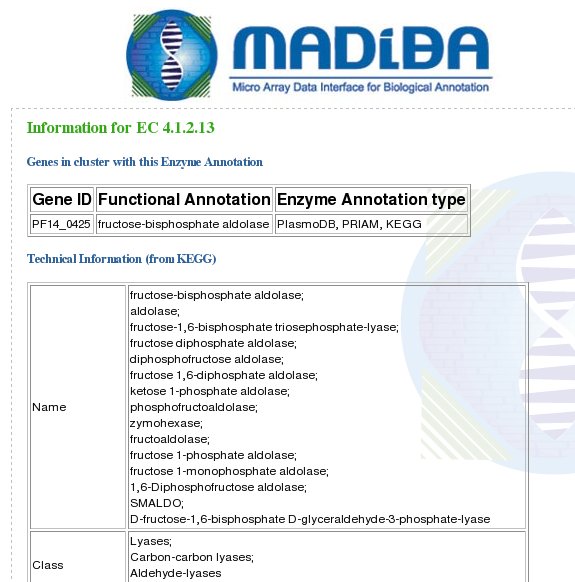
Chromosomal Localisation module:This module permits the highlighting of genes co-expressed and localized in the same region of a chromosome by a visualisation of the genes found on the chromosomes and a diagram with the proportion of the genes of the cluster per chromosome.
Transcription Regulation module:The coordinate expression of a group of functionally related genes implies an underlying pathway-specific transcriptional regulatory mechanism. Accordingly, we also analyse the promotor region of the clustered genes. A module in the MADIBA interface propose 2 different approaches of motif identification:(1) Search of Transcription Factor Binding Sites (TFBS) observed in promotor sequences of co-regulated genes (horizontally) with RSA tools, using oligo-analysis and dyad-analysis. (2) Search for known TFBS in the TRANSFAC database, using the Patch and Match tools. Oligo-analysis  Dyad-analysis 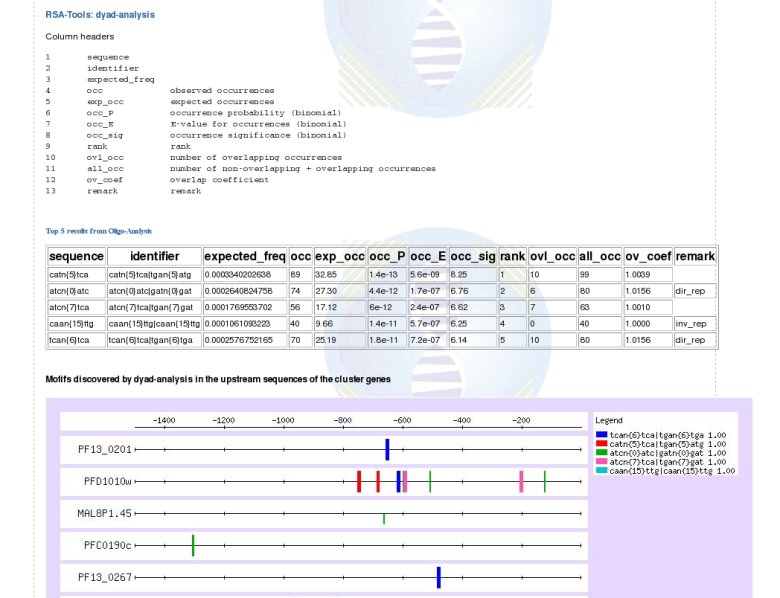
Organism Specific module:For Plasmodium, this module aims to identify potential new drug targets. Effectively, for nearly 65% of the Plasmodium proteins no function is known. Microarray experiments and data mining will be of help to highlight new genes functions. To aid with new drug target identification, a list of all the annotations of the genes without human homologues is generated.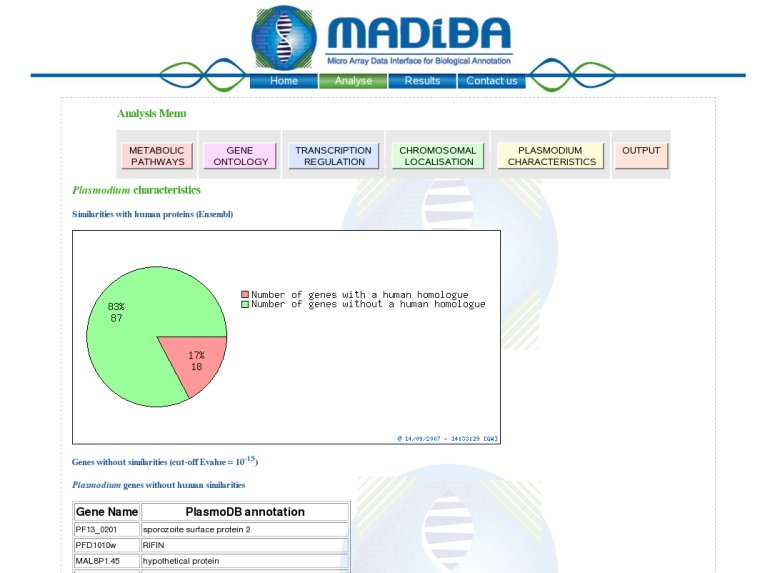 For Arabidopsis and rice, this module returns orthologues between the two, by performing a reciprocal BLAST, as well as a self BLAST for each to identify paralogues, or "gene families". OutputThe results from the above analyses can be outputted in either PDF or plain text format. Obviously, there will be no images in the plain text output.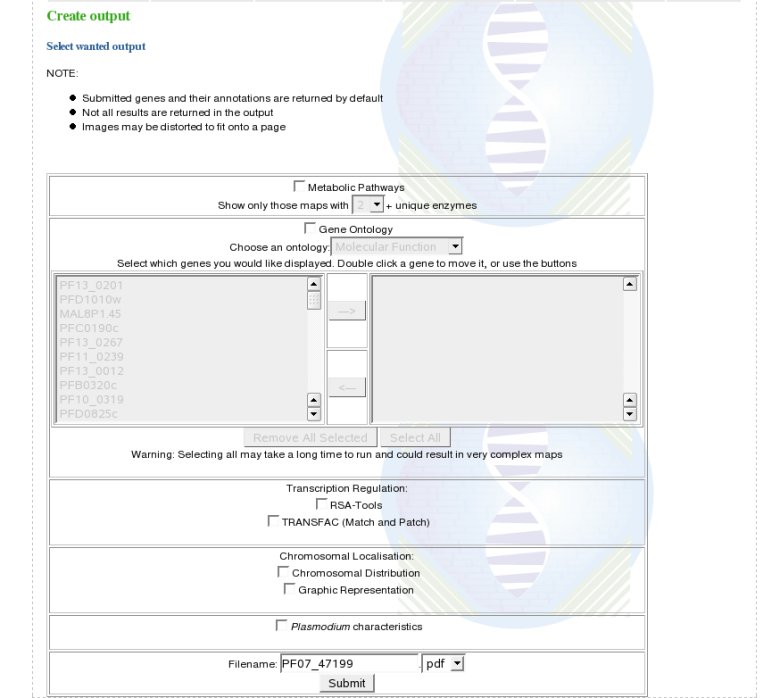 Some resultsWe have tested the functionalities of MADIBA on previous published results. Click here for the results.Thank you for reading this tutorial. We hope you found it useful and will find MADIBA of use. For more information, see the FAQ |
 Busy ... Please wait!